What does BPMN 2.0 look like?
09-01-2026
7 min
Last Updated: January 9, 2026
Quick Answer
BPMN 2.0 uses a standardized set of visual symbols and graphical elements to represent business processes. The core visual elements are Flow Objects (Activities, Events, and Gateways) connected by Sequence Flows. A BPMN diagram uses circles representing Events (start/end points), rectangles representing Activities (work to be done), diamonds representing Gateways (decisions and merges), and arrows representing Sequence Flows (the order of execution). These visual elements create a standardized, executable diagram that business analysts and IT developers can both understand and machine-execute on process automation platforms.
Core BPMN Visual Elements
BPMN 2.0 diagrams are built from three main types of Flow Objects and one connecting element.
Example 1
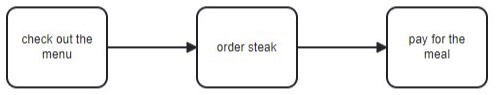
What do I do in a restaurant when I'm hungry? First I check what's on the menu, then I order a steak and finally I pay for the meal.
How would this process be described graphically in BPMN?
Activities and Sequence Flows
The diagram shown above is a very simple representation of a process, but is correct BPMN notation. I used 2 basic elements of the language: activities connected by sequence flows.
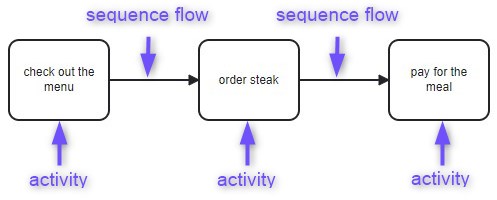
These elements have a precise meaning in BPMN:
- An Activity, depicted as a rectangle with rounded corners, represents some piece of work that is performed.
- A Sequence flow, depicted as a line with a solid arrowhead, is used to show the order (sequence) of a process.
Sequence flows specify the logical order of a process. In this example I can’t order steak until the “check out the menu” is completed. There is a defined sequence of activities.

Events
In the simplest case, such a diagram will be sufficient, but let's add more elements to it to make it more professional.
Example 2
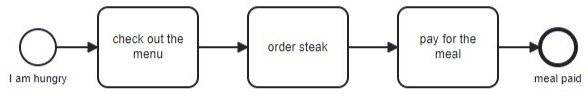
These two additional circles at the beginning and end of the diagram are called Events.
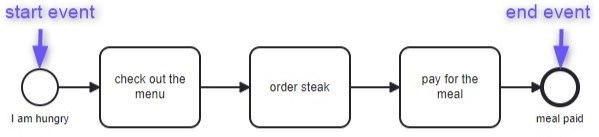
Events in BPMN are depicted as circles.
The term “event” is general enough to cover many things: the start or end of an activity, the change of state of a document, a message that arrives, etc.
In this example I have added two events: the start event (thin circle) and the end event (thick circle).
Events are optional but I highly recommend adding them on diagrams.
Token
In order to better understand how a process is performed, the concept of a token was introduced. A token is a theoretical concept which can be sometimes visualized, as follows:
A token traverses the sequence flows and passes through the elements in the process. This simulation is powered by bpmn.io.
Gateways
In real life, things are more complicated. How would the process change if I want to add a meal option for vegetarians?
Example 3
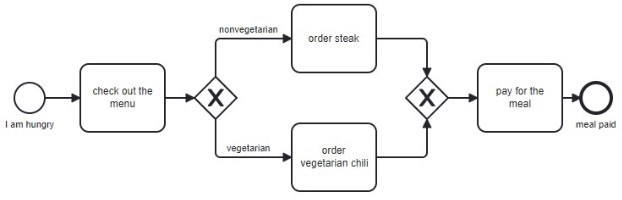
A Gateway is depicted as a diamond and may include a marker inside.
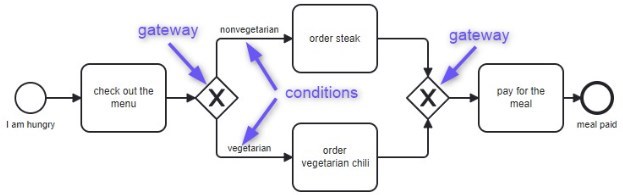
Gateways are used to control the splitting and merging of sequence flows within a Process. The first gateway (diverging) allows splitting the flow into two separate conditional flows - one of which can be chosen. I can order either a nonvegeterianGateways are used to control the splitting and merging of sequence flows within a Process. The first gateway (diverging) allows splitting the flow into two separate conditional flows - one of which can be chosen. I can order either a nonvegetarian meal or a vegetarian meal, but not both. Conditions specify which path can be taken. The second gateway brings flows back together.
Let’s see the simulation of these two distinct scenarios:
Activities, Events and Gateways are called Flow Objects. Flow Objects connected by Sequence Flows are the main graphical elements to define the behavior of a Business Process.
Key Takeaways
📌 BPMN has four core visual symbols: Circles (Events), rectangles (Activities), diamonds (Gateways), arrows (Sequence Flows).
📌 Circles = Events - Start, intermediate, and end points where something happens or triggers action.
📌 Rectangles = Activities - The actual work or tasks being performed in the process.
📌 Diamonds = Gateways - Splitting points and flow merges. Exclusive (choose one), Parallel (do all), or more complex options.
📌 Arrows = Sequence Flows - Show the logical order and direction of flow through the process.
📌 The token concept visualizes process flow - Imagine a token moving through your diagram showing which path is active and where execution is at any moment.
📌 Machine-executable - BPMN diagrams can run directly on BPM platforms and RPA tools, not just be read by humans.
✔❌ BPMN 2.0 Quiz (Level 1, Lesson 2) 📝
Take the BPMN 2.0 Lesson 2 Quiz