What is the difference between UML and BPMN?

16-12-2023
21 min
Last Updated: April 3, 2026
Key Takeaways
- UML (Unified Modeling Language) is used to model the structure and behavior of software systems
- BPMN (Business Process Model and Notation) is used to model business processes and workflows
- UML includes 14 diagram types, covering both structure and behavior
- BPMN includes 4 diagram types, focused on process flow
- UML is primarily used by developers and software architects
- BPMN is designed for business analysts and non-technical stakeholders
- UML models systems, while BPMN models processes
- In practice, UML and BPMN are often used together in the same project
In the world of business and software, we often encounter two acronyms: UML (Unified Modeling Language) and BPMN (Business Process Model and Notation).
👉 In short:
- UML models the structure and behavior of software systems
- BPMN models how business processes operate
While they may seem similar, they serve different purposes and audiences.
UML: Blueprint for Software Architects
UML (Unified Modeling Language) is a standardized modeling language used primarily in software engineering to visualize, design, and document software systems.
It allows you to represent system components and their interactions using diagrams. UML includes 14 diagram types, divided into two main categories.
⚠️ Note: UML is often confused with SysML. UML focuses on software systems, while SysML is used for modeling broader systems that may include hardware, people, and processes.
UML Diagrams
There are two main categories of diagrams: behavior diagrams and structure diagrams.
The first category describes the behavior of a system, i.e. how the system behaves or how it should behave. There are many types of diagrams for this. To visualize a particular system functionality, we can choose one type, or we can use several types that complement each other.
The second category describes structural aspects of the system, including the data model at various levels of abstraction. The data model represents the concepts used by an application and the connection between the system’s various components. In contrast to the behavioral diagrams, the structure diagrams do not show any details of the system’s dynamic aspect (how it changes over time). Structure diagrams are time-independent, because they show only the static structure of the objects in a system.
Behavior diagrams
Use Case Diagram: Functional Overview

An example of a use case diagram for Bank ATM subsystem - top level use cases.
- What it Shows: Think of this as a storyboard for your software. It lays out all the cool things your software can do and who benefits from them.
- Example: For a music app, a use case diagram might showcase actions like Play Song, Create Playlist, and Share Song – all the exciting stuff users can do.
Activity Diagram: Steering Through Steps
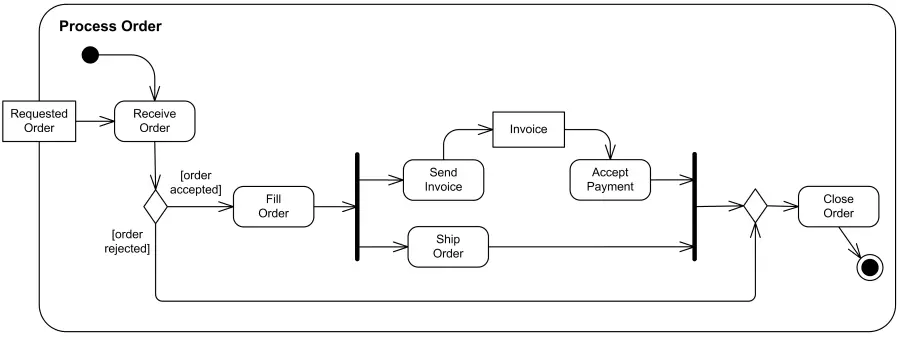
An example of business flow activity to process a purchase order.
- What it Shows: Activity diagrams illustrate the flow of actions in a process or system. Think of an activity diagram as a GPS guiding you step by step through a journey.
- Example: For an online shopping experience, an activity diagram might showcase steps like Browse Products, Add to Cart, and Checkout, helping users navigate the journey from product selection to purchase.
Sequence Diagram: Interaction Timeline

Submit comments to Pluck using DWR, AJAX, JSON - an UML sequence diagram example.
- What it Shows: Have you ever watched a cooking show where ingredients are added one by one? A sequence diagram is like that – it reveals the order in which different parts of your software interact.
- Example: If you're coding a chat application, a sequence diagram could illustrate how a user sends a message, how the server receives it, and then how it gets delivered to the recipient.
State Machine Diagram: The Dance of Transitions

UML State Machine Example - Water Phase Diagram
- What it Shows: Imagine a traffic light changing colors – a state machine diagram captures how an object or system transitions from one state to another in response to events.
- Example: For a mobile app, a state machine diagram could illustrate the different states of a user navigating through screens – from Home to Settings or from Login to Dashboard.
Interaction Overview Diagram: Choreographing Interactions

Example of interaction overview diagram - submit comments to Pluck using DWR, AJAX, JSON.
- What it Shows: An interaction diagram provides a high-level view of interactions between components or objects, emphasizing the flow of control.
- Example: Model the user journey through an online shopping process, depicting the interactions between the user, shopping cart, and payment system.
Communication Diagram: Mapping Collaboration Structures

An example of a UML communication diagram for an online bookshop.
- What it Shows: Illustrates the interactions and relationships between objects or components, emphasizing the flow of messages.
- Example: Represent the communication between various modules in a software application during a data retrieval process.
Timing Diagram: Sequencing Events in Time
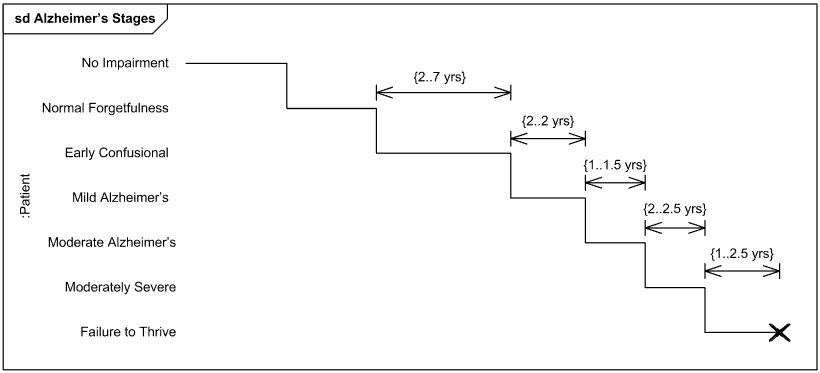
Timing Diagram Example - Stages of Alzheimer’s Disease
- What it Shows: Represents the timing and sequencing of events over a specific duration, emphasizing the temporal aspects of a system.
- Example: Model the timing diagram for a traffic light control system, depicting the duration of each signal phase and the transitions between them.
Structure diagrams
Class Diagram: Structural Blueprint

Online shopping domain UML class diagram example.
- What it Shows: Imagine you're building a house, and each room has a specific purpose. In UML, a class diagram is like the floor plan of a house, showing all the rooms (classes) and how they link together.
- Example: If you're making a game app, your classes might include Player, Game Level, and Score, with lines showing how they're connected.
Component Diagram: Building Blocks in Harmony

Online shopping UML component diagram example with three related subsystems - WebStore, Warehouses, and Accounting.
- What it Shows: This diagram is like an architect's blueprint, showcasing the building blocks of a system and how they fit together.
- Example: If you're creating a banking application, a component diagram might represent modules such as User Interface, Database, and Transaction Processor, showing how they collaborate to form a cohesive system.
Deployment Diagram: Where Software Meets Reality
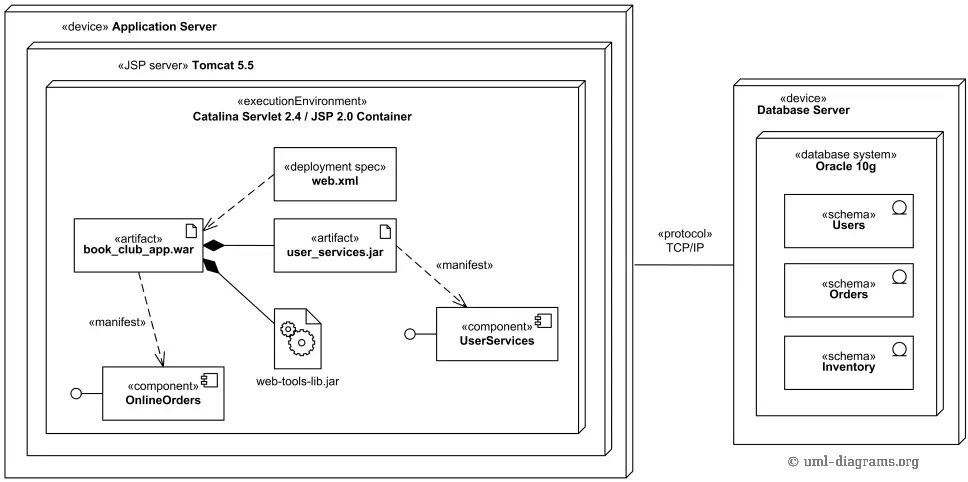
An example of deployment diagram for J2EE web application.
- What it Shows: Picture this as the map of a city, with software components represented as buildings and the connections between them as roads. Deployment diagrams illustrate how software is deployed on hardware.
- Example: For a web application, a deployment diagram could display servers, databases, and user devices, revealing how they interact in the real-world infrastructure.
Package Diagram: Wrapping It Up Neatly
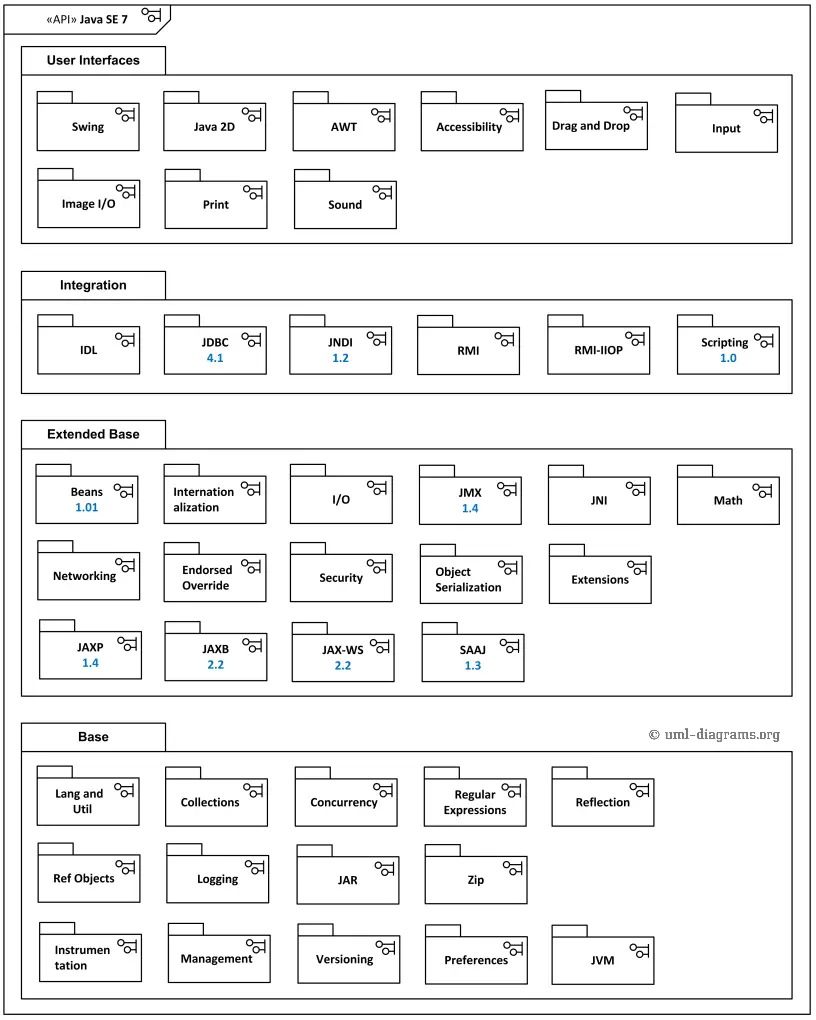
UML package diagram of Java™ Platform Standard Edition 7 API.
- What it Shows: Think of a package diagram as a gift box – it organizes and represents the structure of a system in terms of related packages.
- Example: In a project management software, a package diagram might show different modules like Task Management, User Authentication, and Reporting neatly packaged, highlighting their interconnections.
Composite Structure Diagram: Building Block Blueprints

Bank ATM internal structure UML diagram example
- What it Shows: Illustrates how internal structures of a class or component collaborate, emphasizing the relationships between parts.
- Example: Model the internal architecture of a computer, depicting the connections and collaborations between the CPU, memory, and storage components.
Object Diagram: Snapshot of Instances in Action

User login controller UML object diagram example.
- What it Shows: An object diagram captures a snapshot of instances in a system at a specific point in time, showcasing the relationships between objects.
- Example: Capture an object diagram representing the current state of a chess game, showing the positions and relationships between individual pieces.
Profile Diagram: Tailoring UML for Specific Needs
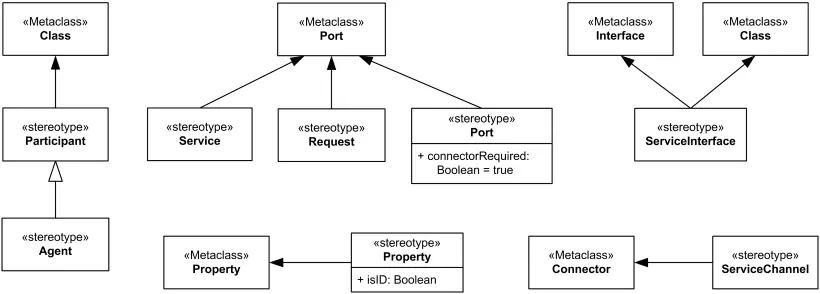
SoaML UML Profile - Services
- What it Shows: Customizes UML for specific domains or purposes, defining stereotypes, tagged values, and constraints.
- Example: Create a profile for a web development framework, introducing specialized stereotypes and constraints to enhance UML for web application modeling.
✅ When to Use UML
Use UML when you need to:
- Design software architecture
- Model system structure and behavior
- Communicate technical designs with developers
- Document complex software systems
Conclusion
UML, with its variety of diagrams, is like a versatile dance floor where each diagram showcases a different dance move. As you waltz through the world of software development, understanding these UML diagrams empowers you to choreograph elegant systems and navigate the complexities of building software with grace.
So, whether you're charting activities, managing states, orchestrating components, deploying software, or neatly packaging ideas, UML has a diagram to suit every step of your journey. Keep dancing through the diagrammatic landscapes of UML, and you'll find yourself confidently leading the software development ball!
BPMN: Choreographing Business Moves
BPMN (Business Process Model and Notation) is a standard used to model and visualize business processes.
Unlike UML, BPMN focuses only on process flow (dynamic behavior) and is designed to be understandable by both technical and business users. BPMN includes 4 diagram types.
BPMN Diagrams
Process Diagram: Guiding Business Steps
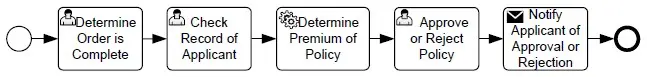
- What it Shows: Picture this as a recipe for baking a cake. It lays out all the steps, from gathering ingredients to pulling out a delicious cake from the oven.
- Example: In a retail business, a process flow diagram might map out the steps from customer order to product delivery – order received, inventory checked, packing, and shipping.
Collaboration Diagram: Coordinating Business Partnerships
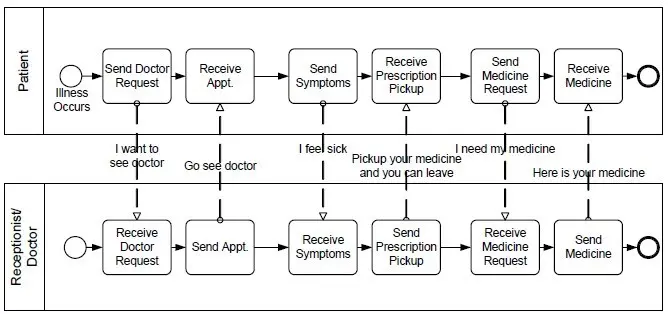
- What it Shows: Think of this as a dance between different business partners. It shows how different participants or roles work together to achieve a common goal.
- Example: In a supply chain, a collaboration diagram might illustrate how suppliers, manufacturers, and distributors coordinate to get products from production to the store shelves.
Choreography Diagram: Capturing Spontaneous Business Interactions
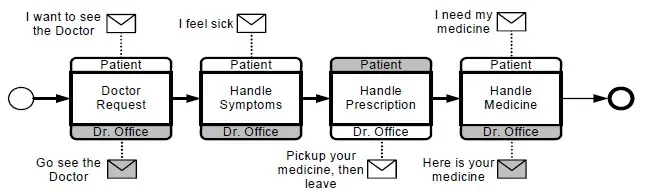
- What it Shows: Imagine a group dance where each person knows their moves without a central choreographer. A choreography diagram reveals interactions between different entities without detailing their internal steps. This type of diagram is not used very often.
- Example: For event planning, a choreography diagram could show the communication flow between the event organizer, venue, and catering service without diving into the nitty-gritty details of each participant's tasks.
Conversation Diagram: Visualizing Business Dialogues

- What it Shows: Imagine the Conversation Diagram in BPMN as a roundtable discussion where various business participants engage in a meaningful dialogue to achieve shared objectives. This visual representation captures the structured dialogues and communications between different participants or business entities.
- Example: Visualize this diagram as a way to choreograph a productive business meeting. It showcases pools representing different entities, such as Customer Support Team, Customer, and Technical Support, and lanes within each pool delineating specific roles or departments. The diagram illustrates how messages flow between these participants, fostering a collaborative and coordinated business conversation.
✅ When to Use BPMN
Use BPMN when you need to:
- Model business processes end-to-end
- Analyze and improve workflows
- Communicate with business stakeholders
- Document operational procedures
Conclusion: Picking the Right Dance Partner
In a nutshell, UML and BPMN are like two different dance styles – one for software and one for business processes. Knowing when to use each is like choosing the right dance floor for the occasion. Whether you're building digital wonders or orchestrating business routines, understanding UML and BPMN helps you dance through the complexities with ease.
UML and BPMN are complementary, not competing standards:
- UML helps design and understand software systems
- BPMN helps analyze and improve business processes
UML vs BPMN: Key Differences
| Feature | UML | BPMN |
|---|---|---|
| Purpose | Software modeling | Business process modeling |
| Focus | Structure and behavior | Process flow only |
| Audience | Developers, architects | Business analysts, stakeholders |
| Diagram Types | 14 | 4 |
| Complexity | More technical | More intuitive |
| Typical Use | System design | Process optimization |
So, the next time you encounter these acronyms, think of them as your handy dance cards for creating amazing software and seamless business processes.
FAQ
Is UML or BPMN better?
Neither - they serve different purposes. UML is for software systems, BPMN is for business processes.
Can UML and BPMN be used together?
Yes. BPMN models business workflows, while UML models the system implementation.
Is BPMN easier than UML?
Generally yes, because BPMN is designed for business users and is more intuitive.
What is the main limitation of BPMN?
It does not model system structure.
What is the main limitation of UML?
It is less suitable for business process modeling from a non-technical perspective.
References
Special thanks to Kirill Fakhroutdinov for permission to use UML diagrams from the uml-diagrams.org website as examples in this article. I highly recommend this site to anyone looking for knowledge about UML. All concepts are very well explained there with examples.
- All UML diagrams: https://www.uml-diagrams.org/
- OMG, Unified Modeling Language (UML) 2.5.1 Specification, available at https://www.omg.org/spec/UML/2.5.1
- All BPMN diagrams: OMG, Business Process Model and Notation (BPMN) 2.0.2 Specification available at https://www.omg.org/spec/BPMN/2.0.2