The 5 Most Useful UML Diagrams for Software Engineers (And When to Use Them)

14-07-2026
28 min
Software engineers don't need to master all 14 UML diagram types to become effective modelers. Discover the five most useful UML diagrams, learn when to use each one, avoid common modeling mistakes, and understand how they fit into modern software development.
Key Takeaways
- UML defines 14 diagram types, but a small subset is sufficient for most software engineering projects.
- Every UML diagram answers a different question about the system being developed.
- Learning Use Case, Activity, Class, Sequence, and State Machine Diagrams provides an excellent foundation for understanding software requirements, structure, behavior, and interactions.
- Choosing the right UML diagram is more important than trying to model everything.
- UML is a communication tool designed to reduce complexity - not to replace source code or generate documentation for its own sake.
- Understanding the purpose of each diagram is valuable both in real-world projects and when preparing for OMG Certified UML Professional (OCUP) certification exams.
Introduction
The Unified Modeling Language (UML) is the world's most widely used standard for visual software modeling. Maintained by the Object Management Group (OMG), UML provides a common language for describing software systems, allowing developers, architects, business analysts, and stakeholders to communicate using a shared set of concepts and diagrams.
One of the first things newcomers discover is that UML defines 14 different diagram types. While this comprehensive set makes UML flexible enough to model a wide variety of systems, it also raises an obvious question:
Do software engineers really need to learn all fourteen diagrams?
In practice, the answer is no.
Although every UML diagram has its purpose, only a handful are used regularly in most software projects. These diagrams help teams answer fundamental questions:
- What should the system do?
- How does the business process or application workflow look?
- What are the main building blocks of the system?
- How do software components collaborate?
- How does an object behave as its state changes?
This article introduces the five UML diagrams that provide the greatest practical value for software engineers. For each diagram, you'll learn:
- its primary purpose,
- when to use it,
- when another UML diagram may be a better choice,
- a real-world example,
- and common modeling mistakes to avoid.
Whether you're starting your UML journey, refreshing your knowledge, or preparing for an OMG certification exam, these five diagrams will give you a strong foundation for understanding and communicating software designs.
Why Software Engineers Use UML
One of the biggest misconceptions about UML is that it exists to replace programming or to generate source code automatically. That has never been its primary purpose.
Instead, UML helps people understand, communicate, and validate software designs before implementation begins.
Think about building a house.
An architect doesn't create a single drawing that attempts to describe everything. Instead, different drawings focus on different aspects of the building:
- a floor plan shows the layout of rooms,
- an electrical plan describes wiring,
- a plumbing plan explains pipe connections,
- structural drawings specify how the building remains stable.
Each drawing presents the same building from a different viewpoint because different specialists need different information.
Software systems are no different:
- A product owner wants to understand what the system should do.
- A developer wants to understand how classes collaborate.
- An architect wants to understand the overall structure of the solution.
- A tester wants to understand the expected behavior.
Trying to answer all these questions with a single diagram would quickly become confusing. Instead, UML provides multiple diagram types, each optimized for a specific purpose.
The goal is not to create as many diagrams as possible. The goal is to create the right diagram for the right audience at the right level of detail.
Good models simplify complex systems. Poor models simply create more complexity.
The Five Diagrams at a Glance
Before diving into each diagram, the following table summarizes the role of each one.
| UML Diagram | Answers the Question | Typical Audience | Most Useful During |
|---|---|---|---|
| Use Case Diagram | What should the system do? | Customers, Product Owners, Business Analysts | Requirements gathering |
| Activity Diagram | How does the workflow or business logic proceed? | Business Analysts, Developers | Analysis and design |
| Class Diagram | What are the main building blocks of the system? | Developers, Architects | Software design |
| Sequence Diagram | How do objects collaborate over time? | Developers, Architects | Detailed design |
| State Machine Diagram | How does an object behave as its state changes? | Developers, Systems Engineers | Behavioral design |
Notice that these diagrams complement rather than replace one another. Together they provide different perspectives on the same system.
1. Use Case Diagram - Understanding User Goals
What Question Does It Answer?
❓What should the system do for its users?
A Use Case Diagram captures the functional requirements of a system from the perspective of external users, known as Actors.
Rather than describing implementation details, databases, or software architecture, it focuses on the goals that users want to accomplish by interacting with the system.
This makes Use Case Diagrams one of the best communication tools during the early stages of a project.
Instead of discussing technical solutions, stakeholders can first agree on what functionality the system should provide.
Real-Life Example
Imagine you're developing an online food delivery application.
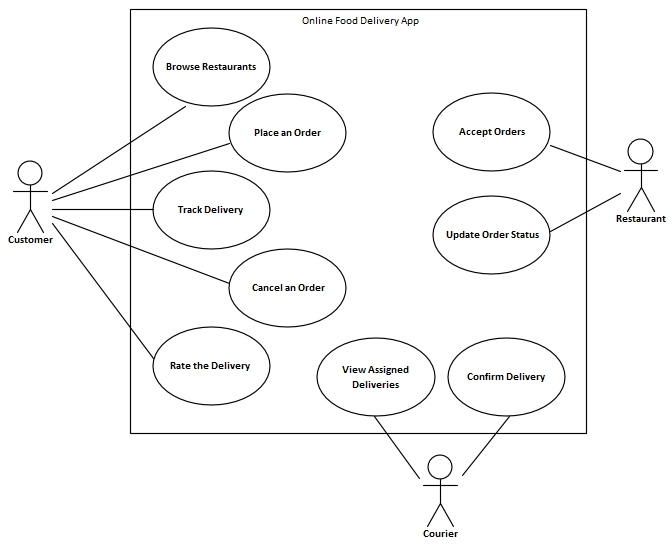 Picture 1: UML Use Case Diagram representing an Online Food Delivery Application
The system interacts with three different Actors:
- Customer
- Restaurant
- Courier
The Customer wants to:
- Browse Restaurants
- Place an Order
- Track Delivery
- Cancel an Order
- Rate the Delivery
The Restaurant wants to:
- Accept Orders
- Update Order Status
The Courier wants to:
- View Assigned Deliveries
- Confirm Delivery
Even without discussing implementation details, the diagram clearly communicates the scope of the system and who interacts with it.
When to Use a Use Case Diagram
Use Case Diagrams are particularly valuable when you want to:
- identify functional requirements,
- define the scope of a project,
- communicate with customers or business stakeholders,
- understand who interacts with the system,
- organize requirements before detailed design begins.
Because they deliberately hide implementation details, they remain easy to understand even for people with little technical background.
When NOT to Use It
A common mistake is trying to describe the internal workflow of a Use Case.
For example: Customer browses restaurants → selects meals → add items to cart → enters delivery address → chooses payment method → receives confirmation.
This is not what a Use Case Diagram is designed to show.
If your goal is to describe the sequence of activities or decision points inside a process, an Activity Diagram is usually a much better choice.
Similarly, if you want to explain how software components exchange messages while implementing a particular Use Case, you should create a Sequence Diagram instead.
Common Mistakes
Some of the most common modeling mistakes include:
- trying to model implementation details,
- confusing Actors with organizational departments,
- creating hundreds of tiny Use Cases instead of focusing on user goals,
- using vague names such as Manage System instead of meaningful business objectives like Place Order or Submit Expense Report.
A good Use Case name should describe what value the user receives, not how the software implements it.
Key Benefits
A well-designed Use Case Diagram helps teams:
- agree on project scope,
- communicate requirements with non-technical stakeholders,
- identify missing functionality,
- avoid implementing features that nobody needs.
For many software projects, it becomes the starting point from which other UML diagrams are developed.
2. Activity Diagram - Understanding Workflows and Business Logic
What Question Does It Answer?
❓How does the work flow through the system?
Once you've identified what the system should do using Use Case Diagrams, the next logical step is understanding how a particular business process or software behavior unfolds.
This is exactly what an Activity Diagram is designed for.
Activity Diagrams describe workflows by showing the sequence of activities, decision points, parallel execution, and the overall flow of control. They provide a high-level view of how work progresses from a starting point to a desired outcome.
Unlike Sequence Diagrams, which focus on interactions between objects, Activity Diagrams emphasize the flow of work.
They are therefore easy to understand, even for people without a software engineering background.
Real-Life Example
Imagine an online shopping application.
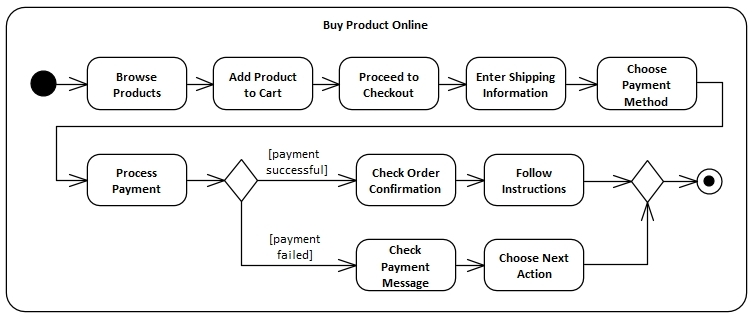 Picture 2: Buy Product Online process represented as an Activity Diagram
A customer purchases a product through the following workflow:
- Browse Products
- Add Product to Cart
- Proceed to Checkout
- Enter Shipping Information
- Choose Payment Method
- Process Payment
At this point, the process branches depending on the payment result.
If the payment succeeds:
- Receive payment confirmation
- See order confirmation
- Get informed that the product will be shipped
- Wait for product delivery
If the payment fails:
- See a payment failure message
- Get informed that the payment was not completed
- Option to retry the payment or change the payment method
This entire business workflow can be represented clearly in a single Activity Diagram without discussing software classes or technical implementation.
When to Use an Activity Diagram
Activity Diagrams are an excellent choice when you want to:
- describe business processes,
- model application workflows,
- document algorithms,
- explain decision logic,
- communicate behavior to both technical and non-technical audiences.
Because they focus on activities rather than implementation details, they are often one of the easiest UML diagrams for newcomers to understand.
When NOT to Use It
Although Activity Diagrams are versatile, they are not the best choice for every situation.
For example, they do not necessarily explain which software components exchange information.
Suppose you want to show how a web application communicates with an authentication service, which in turn queries a database.
An Activity Diagram might simply contain:
- Validate Credentials
A Sequence Diagram, however, would reveal the individual interactions:
- Web Application → Authentication Service
- Authentication Service → Database
- Database → Authentication Service
- Authentication Service → Web Application
If object collaboration is important, a Sequence Diagram communicates the design much more effectively.
Likewise, if you want to describe the static structure of the system, a Class Diagram is a better choice.
Common Mistakes
One of the most common mistakes is trying to include too many implementation details. An Activity Diagram should describe what happens, not every method call or database operation.
Other frequent mistakes include:
- mixing business activities with software implementation,
- creating activities that are too large or too small,
- forgetting decision conditions,
- overusing parallel paths where sequential execution would be clearer.
A well-designed Activity Diagram tells a simple story that anyone involved in the project can follow.
Key Benefits
Activity Diagrams help teams:
- understand business processes,
- validate workflows before implementation,
- identify missing or unnecessary activities,
- discover opportunities for automation,
- communicate complex behavior using an intuitive visual notation.
Because of their simplicity and flexibility, Activity Diagrams often become the first behavioral model created after gathering requirements.
3. Class Diagram - Understanding the Structure of the System
What Question Does It Answer?
❓What are the main building blocks of the software?
If Use Case Diagrams explain what the system should do and Activity Diagrams describe how work flows, Class Diagrams answer another fundamental question:
❓What is the software made of?
A Class Diagram represents the static structure of a system. It identifies the main concepts, the data they contain, their responsibilities, and the relationships between them.
For object-oriented software development, this is arguably the most important design diagram. Rather than focusing on execution, it focuses on the architecture of the solution.
Real-Life Example
Consider a Library Management System.
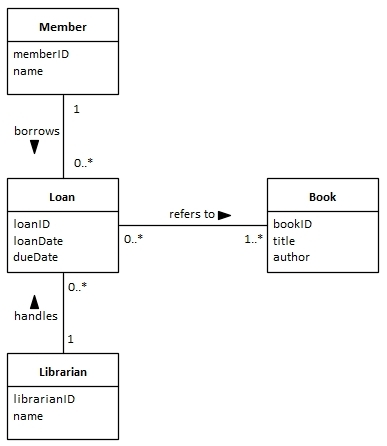 Picture 3: Simplified domain Class Diagram for Library Management System
A simplified Class Diagram could contain the following classes:
- Book
- Member
- Loan
- Librarian
The relationships reveal how these concepts interact.
- A Member can borrow multiple Books.
- Each borrowing operation creates a Loan.
- A Librarian handles active loans.
The diagram communicates the domain model long before implementation begins. Developers can discuss responsibilities and relationships without writing a single line of code.
Note: This diagram is intentionally simplified to demonstrate the fundamental concepts of UML Class Diagrams. In practice, a Library Management System can be modeled in many different ways, ranging from a small domain model to a comprehensive software design with dozens of classes and relationships. The appropriate level of detail always depends on the purpose of the model and the project's requirements.
When to Use a Class Diagram
Class Diagrams are ideal for:
- domain modeling,
- object-oriented analysis,
- software architecture,
- API design,
- documenting the structure of existing systems.
They are particularly valuable during design because they help ensure that the software architecture reflects the business domain.
When NOT to Use It
A Class Diagram should not be used to explain how objects collaborate during a specific scenario.
For example, a Class Diagram can show that:
- Customer
- Order
- PaymentService
exist within the system.
It cannot explain the sequence of interactions during order placement. For that purpose, a Sequence Diagram is much more appropriate.
Similarly, if your goal is to explain a business workflow, an Activity Diagram will usually be easier to understand.
Common Mistakes
Many beginners attempt to reproduce their source code in a Class Diagram.
As a result, the model becomes cluttered with:
- every attribute,
- every operation,
- every utility class,
- every implementation detail.
This defeats the purpose of modeling.
A good Class Diagram highlights only the concepts that are important for understanding the system.
Remember: A model is an abstraction - not a code listing.
Key Benefits
Class Diagrams help teams:
- establish a common vocabulary,
- validate software architecture,
- discover missing relationships,
- identify redundant concepts,
- improve communication between developers and architects.
For object-oriented software, they often become the foundation for many other UML diagrams.
4. Sequence Diagram – Understanding Object Interactions
What Question Does It Answer?
❓How do software components collaborate to accomplish a specific task?
While a Class Diagram describes the static structure of a system, a Sequence Diagram explains how the objects or components within that structure interact over time.
It focuses on the chronological exchange of messages between participants involved in a particular scenario. This makes Sequence Diagrams especially valuable when designing or documenting software behavior.
Unlike Activity Diagrams, which describe the flow of work, Sequence Diagrams answer a different question:
❓Who communicates with whom, in what order, and by exchanging which messages?
For software developers, this is often one of the most practical UML diagrams because it closely resembles the interactions that eventually become method calls, API requests, or service invocations.
Real-Life Example
Let's continue with the online food delivery application.
Suppose a customer places an order.
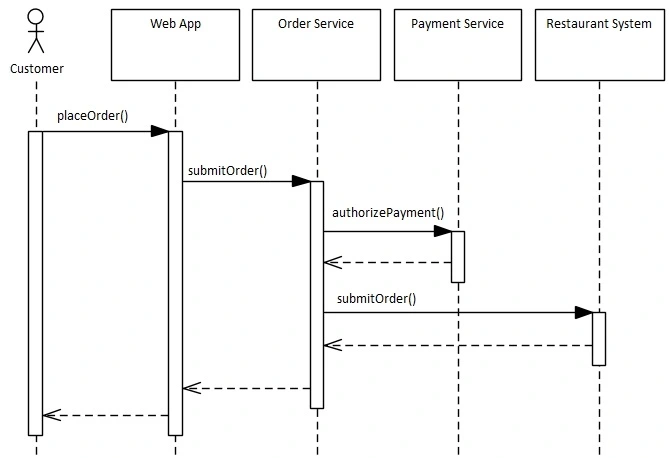 Picture 4: Sequence Diagram describing interactions in an Online Food Delivery App
The participating objects could include:
- Customer
- Web Application
- Order Service
- Payment Service
- Restaurant System
The interaction might proceed as follows:
- The Customer submits an order.
- The Web Application sends the order details to the Order Service.
- The Order Service requests payment authorization from the Payment Service.
- The Payment Service confirms that the payment has been approved.
- The Order Service forwards the order to the Restaurant System.
- The Customer gets order confirmation.
Notice that the workflow itself has not changed. What has changed is the perspective. Instead of showing activities, we now focus on the communication between software components.
When to Use a Sequence Diagram
Sequence Diagrams are particularly useful when you want to:
- design APIs,
- document service interactions,
- model microservice communication,
- describe object collaboration,
- validate interaction scenarios before implementation,
- explain complex software behavior to developers.
Because they closely mirror runtime execution, they are widely used during software design and code reviews.
When NOT to Use It
Sequence Diagrams are designed to model individual scenarios, not the entire structure of a system.
If your goal is to describe:
- classes,
- relationships,
- inheritance,
- associations,
a Class Diagram is the appropriate choice.
Similarly, if you're explaining an overall business workflow such as Order Fulfillment, an Activity Diagram will usually communicate the process much more clearly.
Trying to model a complete business process as a Sequence Diagram often results in an unnecessarily large and difficult-to-read interaction model.
Common Mistakes
The most common mistakes include:
- trying to model every method call,
- mixing multiple unrelated scenarios into one diagram,
- using inconsistent abstraction levels,
- forgetting that Sequence Diagrams represent one particular execution scenario, not every possible system behavior.
A good Sequence Diagram tells a single story. If the diagram no longer fits comfortably on one page, it is often a sign that it should be divided into several smaller interaction scenarios.
Key Benefits
Sequence Diagrams help teams:
- understand software interactions,
- validate interface design,
- identify unnecessary dependencies,
- improve API design,
- communicate implementation ideas before coding begins.
For many software engineers, they provide the missing link between requirements and implementation.
5. State Machine Diagram – Understanding State-Dependent Behavior
What Question Does It Answer?
❓How does an object behave as its state changes over time?
Some software components behave differently depending on their current condition.
For example:
- A door can be Locked or Unlocked.
- An order can be Created, Paid, Shipped, or Delivered.
- A network connection can be Disconnected, Connecting, or Connected.
A State Machine Diagram models this type of behavior by describing:
- the possible states,
- the events that trigger transitions,
- and the conditions under which those transitions occur.
Unlike Activity Diagrams, which describe workflows, State Machine Diagrams describe the lifecycle of a single object.
Real-Life Example
Consider an Order in the online food delivery application.
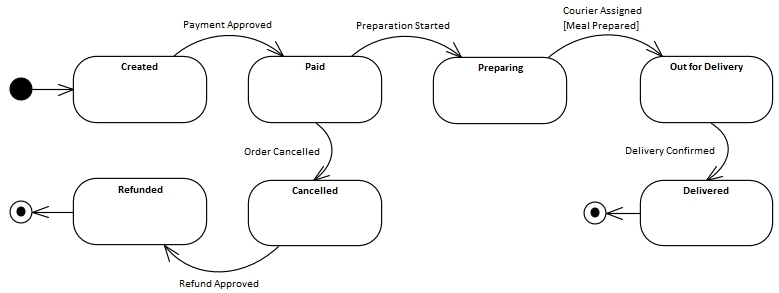 Picture 5: State Machine Diagram describing different states of the Order
Initially, the order is in the Created state. After successful payment, it transitions to Paid. When the restaurant starts preparing the meal, the order becomes Preparing. After pickup by the courier, it changes to Out for Delivery. Finally, once the customer receives the order, it enters the Delivered state.
Depending on business rules, additional states may also exist, such as: Cancelled or Refunded
Each transition is triggered by a specific event, such as:
- Payment Approved
- Preparation Started
- Courier Assigned
- Delivery Confirmed
The diagram clearly illustrates how the order evolves throughout its lifecycle.
When to Use a State Machine Diagram
State Machine Diagrams are ideal for modeling:
- embedded systems,
- communication protocols,
- IoT devices,
- workflow objects,
- devices with operating modes,
- user interface components.
Whenever an object's behavior depends on its current state, a State Machine Diagram is often the best modeling choice.
When NOT to Use It
State Machine Diagrams are not intended to describe complete business processes.
If you need to model the order fulfillment workflow involving multiple participants and activities, an Activity Diagram or BPMN Process Diagram is generally more appropriate.
Similarly, if your focus is on interactions between software components, a Sequence Diagram communicates those relationships much more effectively.
Common Mistakes
Typical modeling mistakes include:
- confusing activities with states,
- creating states that represent actions rather than conditions,
- omitting transition events,
- introducing unnecessary states that add complexity without improving understanding.
Remember: A state answers the question:
❓What condition is the object currently in?
It does not describe what the object is doing.
Key Benefits
State Machine Diagrams help teams:
- understand complex object behavior,
- identify missing transitions,
- validate lifecycle rules,
- discover impossible or invalid states,
- design robust event-driven software.
They are particularly valuable in embedded systems and systems engineering, where state-dependent behavior is common.
Which Diagram Should You Learn First?
There is no single "correct" order for learning UML diagrams.
However, based on my experience teaching UML to hundreds of software professionals and contributing to OMG certification programs, I recommend the following approach to learning:
| Order | UML Diagram | Why Learn It First? |
|---|---|---|
| 1 | Use Case Diagram | Understand what the system should do from the user's perspective. |
| 2 | Activity Diagram | Learn how the system or business process behaves by modeling workflows and decision logic. |
| 3 | Class Diagram | Discover the main concepts, relationships, and structure of the software. |
| 4 | Sequence Diagram | Understand how software components collaborate to execute specific scenarios. |
| 5 | State Machine Diagram | Model objects whose behavior depends on their current state. |
This learning path follows the natural evolution of a software project - from understanding requirements to designing software behavior.
UML Diagram Comparison
| Diagram | Primary Focus | Best For | Not Ideal For |
|---|---|---|---|
| Use Case Diagram | User goals | Capturing functional requirements | Internal workflows |
| Activity Diagram | Workflow | Business logic and processes | Object interactions |
| Class Diagram | Structure | Software architecture and domain models | Runtime behavior |
| Sequence Diagram | Collaboration | API and object interactions | Overall business workflows |
| State Machine Diagram | Object lifecycle | State-dependent behavior | Process modeling |
Quick Reference
| If you want to... | Use This Diagram |
|---|---|
| Capture user requirements | Use Case Diagram |
| Describe a workflow | Activity Diagram |
| Design the software structure | Class Diagram |
| Explain API or object interactions | Sequence Diagram |
| Model an object's lifecycle | State Machine Diagram |
Frequently Asked Questions
Do software engineers need to know all 14 UML diagrams?
Not necessarily.
While UML defines fourteen diagram types, many software projects rely primarily on the five diagrams presented in this article. Together, they provide an excellent foundation for understanding requirements, workflows, software structure, object interactions, and state-dependent behavior.
Which UML diagram is the most important?
There is no universal answer. Each diagram answers a different question and serves a different audience.
Instead of asking which diagram is "best," ask:
❓What am I trying to communicate?
The answer will usually determine the most appropriate diagram.
Should I use Activity Diagrams or BPMN?
Both can model workflows, but they have different purposes.
- Use Activity Diagrams when modeling software behavior or algorithms.
- Use BPMN when describing business processes involving multiple participants, events, business rules, and organizational responsibilities.
Can multiple UML diagrams describe the same system?
Yes - and they often should.
A Use Case Diagram might define the system's functionality, an Activity Diagram could explain the workflow for one use case, a Sequence Diagram might show how software components implement that workflow, and a Class Diagram would describe the underlying software structure.
These diagrams complement one another by presenting different perspectives of the same system.
Why This Matters
One of the biggest mistakes organizations make is believing that UML is primarily about creating documentation. It isn't. UML is about communication.
A well-chosen diagram helps stakeholders understand requirements, allows architects to explain design decisions, enables developers to discuss implementation strategies, and helps testers validate expected behavior before software is built.
Notice that none of the five diagrams presented in this article tries to describe everything. Each focuses on answering one specific question.
That is precisely why UML remains valuable after more than two decades. Rather than creating one overly complicated model, it encourages us to communicate different aspects of a system using the diagram best suited to the task.
Whether you're working on a small web application or a complex distributed system, choosing the right UML diagram will almost always improve communication - and better communication leads to better software.
Why Trust This Article?
This article was written by Filip Stachecki, an OMG-certified expert, experienced trainer, and member of the OMG teams responsible for defining the OCUP (UML) and OCEB2 (BPM) certification programs. He has contributed to exam scopes and co-authored official certification exam questions, bringing both practical and standards-based expertise to this article.
The content is based on years of practical experience delivering UML, SysML, and BPMN training to software engineers, business analysts, architects, and systems engineers worldwide. It also reflects insights gained through contributing to the development of OMG certification exams.
Rather than attempting to explain every aspect of UML, this article focuses on the diagrams that consistently provide the greatest value in real-world software development while remaining aligned with the UML specification and industry best practices.
About eduMAX
At eduMAX, we believe that effective modeling is about understanding systems - not memorizing notation.
We provide high-quality learning resources covering UML®, SysML®, BPMN®, DMN®, CMMN®, and Model-Based Systems Engineering (MBSE), helping professionals develop practical modeling skills and prepare confidently for OMG certifications.
Our courses, practice exams, and technical articles are designed for software engineers, business analysts, solution architects, and systems engineers who want to build models that improve communication, reduce project risk, and support better decision-making.
Whether you're learning UML for the first time or preparing for an advanced OMG certification, our goal is to help you model with confidence and apply industry standards effectively.